Financial ratios
Key financial ratios explained with formulas and examples: liquidity (current ratio, quick ratio, working capital), leverage, profitability (margins, ROA, ROE) and activity (days sales outstanding), and how GoSoft computes them with traffic lights and trends.
Financial ratios turn the financial statements into a few easy-to-compare figures: can the company pay its debts? how much does the owners' capital earn? how long does it take to collect? Each number answers a specific question.
- Compute and interpret liquidity, leverage, profitability and activity ratios.
- Understand why a "good" ratio depends on the type of business.
- Read GoSoft's ratios with their traffic lights and trend.
Base example
We use the statements from The four financial statements: current assets 367,000,000 (of which 270,000,000 is property inventory and 45,000,000 cash and banks), current liabilities 20,000,000, total liabilities 120,000,000, total assets 559,000,000, equity 439,000,000, sales 300,000,000, gross profit 180,000,000, net profit 39,000,000, receivables 52,000,000.
Liquidity: can it pay short-term obligations?
| Ratio | Formula | Example | Reading |
|---|---|---|---|
| Current ratio | Current assets / Current liabilities | 18.4 | Each unit of short-term debt is covered 18.4 times |
| Quick ratio | (Current assets − Inventory) / Current liabilities | 4.9 | Without selling inventory, coverage is 4.9 times |
| Cash ratio | Cash and banks / Current liabilities | 2.3 | Cash covers short-term debt 2.3 times |
| Working capital | Current assets − Current liabilities | 347,000,000 | Resources to operate |
Leverage: who finances the company?
| Ratio | Formula | Example |
|---|---|---|
| Debt ratio | Total liabilities / Total assets | 21.5% |
| Debt to equity | Total liabilities / Equity | 0.27 |
Profitability: how much does it earn?
| Ratio | Formula | Example |
|---|---|---|
| Gross margin | Gross profit / Sales | 60.0% |
| Net margin | Net profit / Sales | 13.0% |
| ROA (return on assets) | Net profit / Total assets | 7.0% |
| ROE (return on equity) | Net profit / Equity | 8.9% |
Activity: how fast does it turn?
| Ratio | Formula | Example |
|---|---|---|
| Days sales outstanding | Receivables / Sales × 365 | 63 days |
| Days inventory | Inventory / Cost of sales × 365 | depends on the business |
A real estate developer has a very high current ratio because its lots are inventory; a supermarket lives with a current ratio near 1 because it collects in cash and pays at 60 days. Always compare with the same business over time and with companies in the same industry.
In GoSoft, step by step
Open Financial reports → Financial ratios. Choose units, fiscal year and closing month (by default, the last closed month), and click Calculate.
Each ratio shows its value, a traffic light (healthy, attention, critical), the same month last year, a trend line and a plain-language explanation.
gosoft.app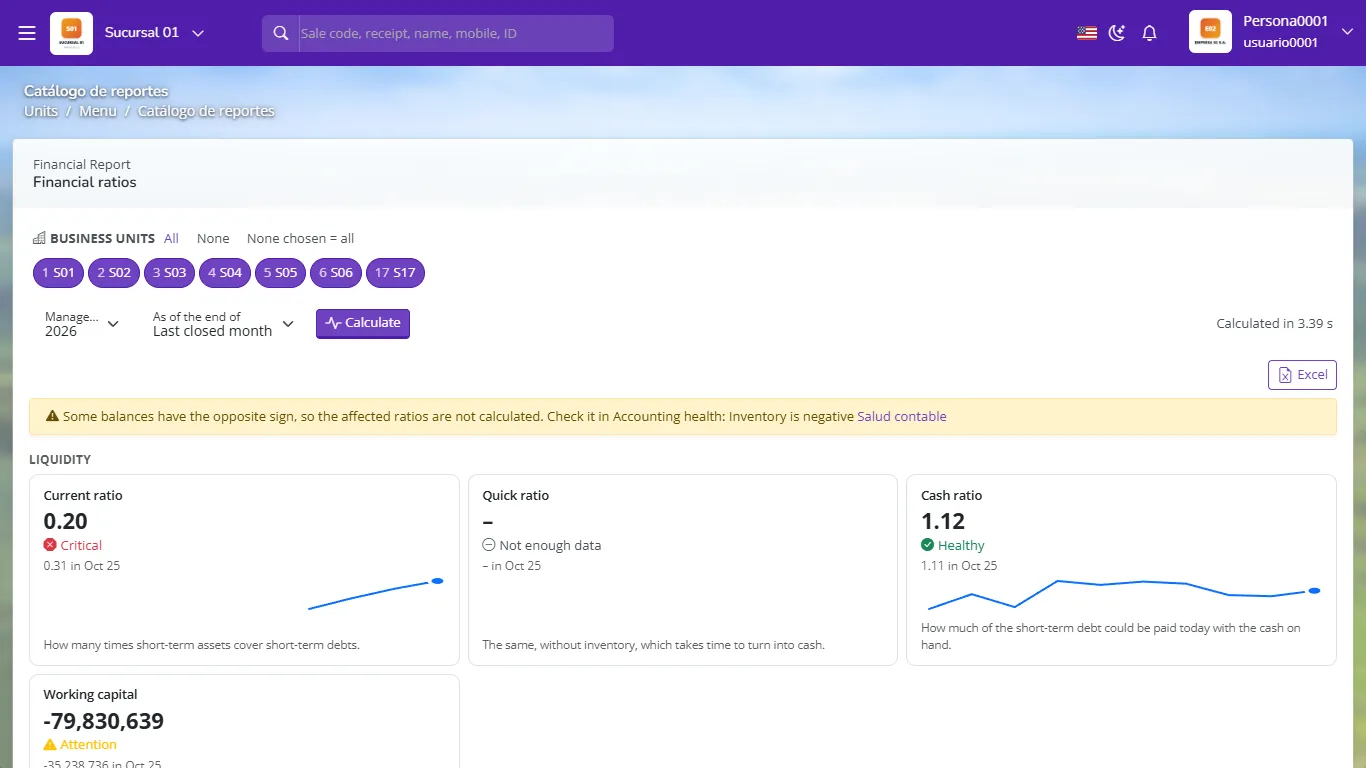
Financial ratios with traffic lights, comparison and trend If the books have balances with the wrong sign (for example, negative inventory), GoSoft does not compute the affected ratios and sends you to accounting health: a ratio on wrong data misleads more than it helps.
Export to Excel for your reports.
Current assets 500, current liabilities 250, inventory 200. Current and quick ratio?
Current ratio 2.0; quick ratio (500 − 200) / 250 = 1.2.
Net profit 60 and equity 400. What is ROE?
15%.
Receivables 90 and annual sales 730. How many days sales outstanding?
90 / 730 × 365 = 45 days.
Why does GoSoft not compute a ratio when balances have the wrong sign?
Because the result would be misleading; the books must be corrected first.