Management dashboard
How to use GoSoft's management dashboard for the monthly management meeting: month and year summary, comparison with last year, revenue and expenses month by month, and export to PDF and PowerPoint.
Management does not need to see the journal: it needs five or six well-chosen numbers, compared with the past, and an understanding of what happened. GoSoft's management dashboard builds that summary by itself, ready for the monthly meeting.
- Prepare a month's dashboard in a few minutes.
- Interpret the summary figures and their variances.
- Present it on screen or export it to PDF and PowerPoint.
What it shows
| Block | Content |
|---|---|
| Month summary | Revenue, expenses and costs, result and margin, with the change vs. the same month last year |
| Year to date | Year-to-date revenue, result and margin, and closing cash |
| Month by month | Chart of revenue and expenses for each month of the year |
| Detail | Main revenue and expense accounts, by unit |
In GoSoft, step by step
Open Financial reports → Management dashboard.
Choose the units, the fiscal year and the meeting month (by default, the last closed month). Click View.
gosoft.app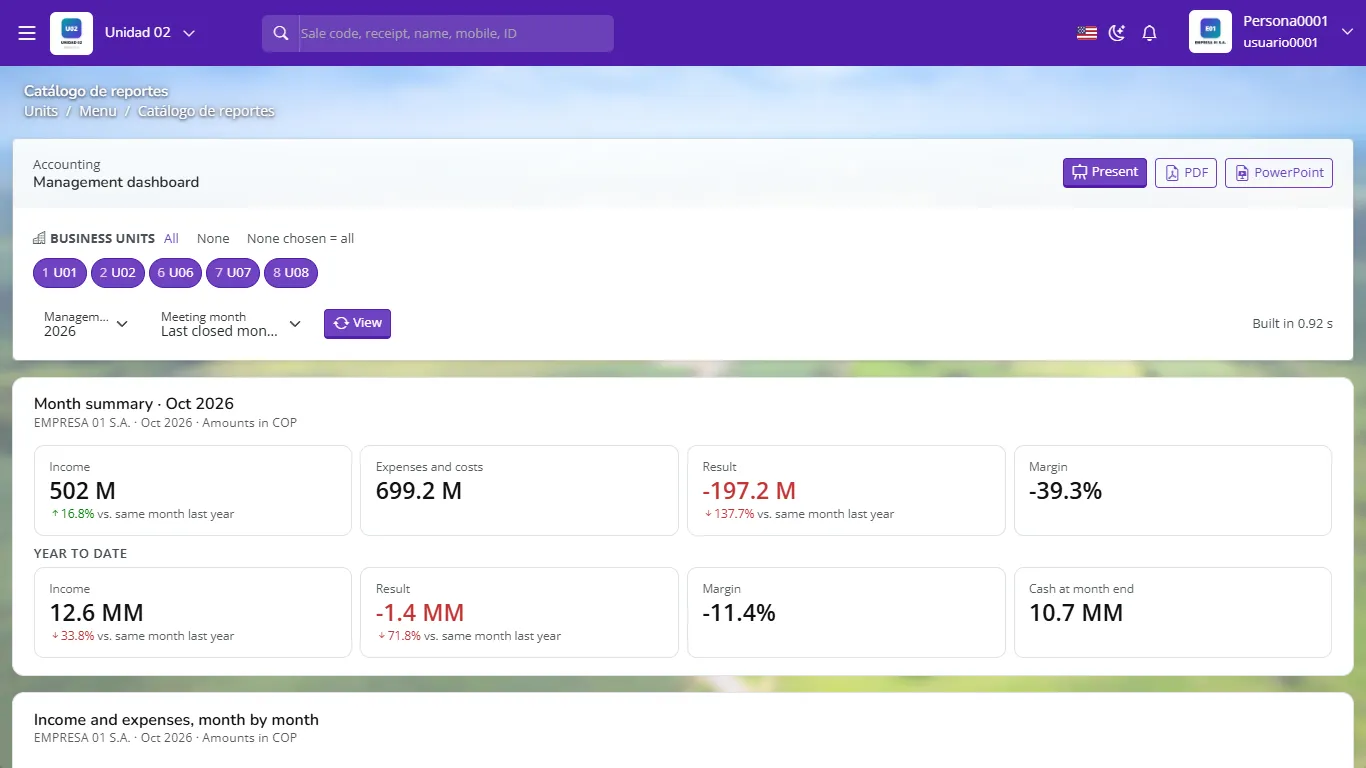
Management dashboard: month summary and year to date Read the summary: arrows and colors show whether each figure improved or worsened compared with last year.
Click Present to show it full screen in the meeting, or download PDF or PowerPoint to send it.
- Result for the month and the year (5 minutes).
- The three largest variances vs. budget (10 minutes).
- Cash and collections: closing cash and overdue receivables (10 minutes).
- Decisions and owners (5 minutes).
By default the dashboard uses the last closed month so figures do not change after the meeting. If you present an open month, say the numbers are preliminary.
What does the dashboard compare the month's result with?
The same month last year.
Why does the dashboard use the last closed month?
So the figures presented do not change after the meeting.
In which formats can you export the dashboard?
PDF and PowerPoint, besides presenting it on screen.